Checks and dependencies
Define what to monitor, how services depend on infrastructure and which events require action.
Riccardo Corsanici · Take Two
Operational visibility across networks, systems and services. Clear information for technical teams and decision-makers.
Monitoring & dashboards
An alert is useful when it reaches the right resource and helps them make a decision.
With Nagios and Icinga, we monitor hosts, services and dependencies: useful checks, appropriate thresholds and organised notifications. Alert management needs clear responsibilities and escalation procedures.
Dashboards connect technical information to operational needs. Availability, anomalies, capacity and critical issues should be understandable to both system operators and project stakeholders.
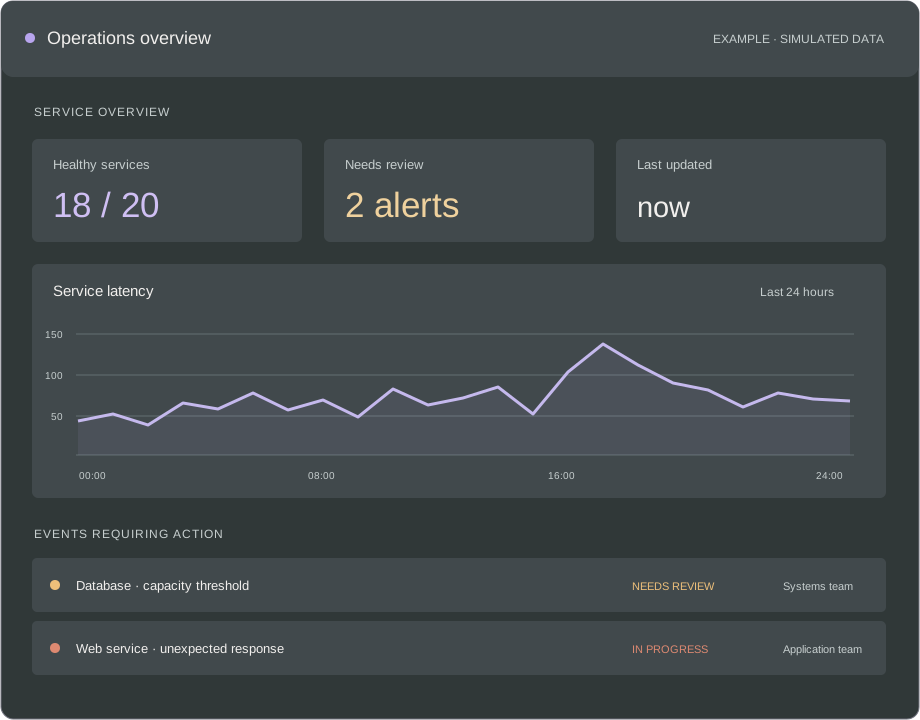
Define what to monitor, how services depend on infrastructure and which events require action.
Set appropriate thresholds and escalation procedures, with clear responsibilities for taking action.
Bring service status, anomalies, capacity and relevant events into a view suited to operators and project stakeholders.
Keep checks aligned with changing systems and connect monitoring information to inventory, applications and procedures.
Discuss the scope and the support you need.
Monitoring project experience ↗